GroupBy
pandas提供了一个灵活高效的groupby功能,它使你能以一种自然的方式对数据集进行切片、切块、摘要等操作。根据一个或多个键(可以是函数、数组或DataFrame列名)拆分pandas对象。计算分组摘要统计,如计数、平均值、标准差,或用户自定义函数。对DataFrame的列应用各种各样的函数。应用组内转换或其他运算,如规格化、线性回归、排名或选取子集等。计算透视表或交叉表。执行分位数分析以及其他分组分析
groupby
DataFrame.groupby(by=None,
                  axis=0,
                  level=None,
                  as_index=True,
                  sort=True,
                  group_keys=True,
                  squeeze=False, **kwargs)
数据分组
将一个dataframe对象分割成组
import pandas as pd
df = pd.DataFrame({'A': ['girl', 'boy', 'girl', 'boy',
                         'girl', 'boy', 'girl', 'girl'],
                   'B': ['one', 'one', 'two', 'three',
                         'two', 'two', 'one', 'three'],
                   'C': [3,1,4,5,6,7,8,1],
                   'D': [9,1,2,3,1,6,4,3]})
      A      B  C  D
0  girl    one  3  9
1   boy    one  1  1
2  girl    two  4  2
3   boy  three  5  3
4  girl    two  6  1
5   boy    two  7  6
6  girl    one  8  4
将数据进行分组:
grouped = df.groupby('A')
print(grouped)
# <pandas.core.groupby.generic.DataFrameGroupBy object at 0x0000019FAE11DE08>

grouped = df.groupby(['A','B'])
print(grouped)
# <pandas.core.groupby.generic.DataFrameGroupBy object at 0x000002AA51E3E2C8>
示例
>>> import pandas as pd
>>> df = pd.DataFrame({'key1':['a', 'a', 'b', 'b', 'a'],
...     'key2':['one', 'two', 'one', 'two', 'one'],
...     'data1':np.random.randn(5),
...     'data2':np.random.randn(5)})
>>> df
      data1     data2 key1 key2
0 -0.410673  0.519378    a  one
1 -2.120793  0.199074    a  two
2  0.642216 -0.143671    b  one
3  0.975133 -0.592994    b  two
4 -1.017495 -0.530459    a  one
假设你想要按 key1 进行分组,并计算 data1 列的平均值,我们可以访问 data1 ,并根据 key1调用 groupby:
>>> grouped = df['data1'].groupby(df['key1'])
# grouped = df.groupby(df['key1'])['data1'] 同样的结果
>>> grouped
<pandas.core.groupby.SeriesGroupBy object at 0x04120D70>
变量grouped是一个GroupBy对象,它实际上还没有进行任何计算,只是含有一些有关分组键 df['key1'] 的中间数据而已,然后我们可以调用GroupBy的mean方法来计算分组平均值:
>>> grouped.mean()
key1
a      -1.182987
b       0.808674
dtype: float64
说明:数据(Series)根据分组键进行了聚合,产生了一个新的Series,其索引为 key1 列中的唯一值。之所以结果中索引的名称为key1,是因为原始DataFrame的列df['key1']就叫这个名字。
如果我们一次传入多个数组,就会得到不同的结果:
>>> means = df['data1'].groupby([df['key1'], df['key2']]).mean()
>>> means
key1  key2
a     one    -0.714084
      two    -2.120793
b     one     0.642216
      two     0.975133
dtype: float64
通过两个键对数据进行了分组,得到的Series具有一个层次化索引(由唯一的键对组成)
>>> means.unstack()
key2       one       two
key1
a    -0.714084 -2.120793
b     0.642216  0.975133
无论你准备拿groupby做什么,都有可能会用到GroupBy的size方法,它可以返回一个含有分组大小的Series:
>>> df.groupby(['key1', 'key2']).size()
key1  key2
a     one     2
      two     1
b     one     1
      two     1
dtype: int64
属性 groups
GroupBy.groups
返回值类型:Dict {group name -> group labels}
df.groupby('A').groups
# {'boy': Int64Index([1, 3, 5], dtype='int64'),
#  'girl': Int64Index([0, 2, 4, 6, 7], dtype='int64'#)}
属性 indices
GroupBy.indices
Dict {group name -> group indices}
df.groupby('A').indices
# {'boy': array([1, 3, 5], dtype=int64),
#  'girl': array([0, 2, 4, 6, 7], dtype=int64)}
函数 get_group()
获取分组后的数据 get_group
get_group('key name')
grouped = df.groupby('A')
print(grouped.get_group('boy'))

#     A      B  C  D
#1  boy    one  1  1
#3  boy  three  5  3
#5  boy    two  7  6
print(grouped.get_group('girl'))


#      A      B  C  D
#0  girl    one  3  9
#2  girl    two  4  2
#4  girl    two  6  1
#6  girl    one  8  4
#7  girl  three  1  3
迭代遍历分组
GroupBy对象支持迭代,可以产生一组二元元组(由分组名和数据块组成)
import pandas as pd

ipl_data = {'Team': ['Riders', 'Riders', 'Devils', 'Devils', 'Kings',
         'kings', 'Kings', 'Kings', 'Riders', 'Royals', 'Royals', 'Riders'],
         'Rank': [1, 2, 2, 3, 3,4 ,1 ,1,2 , 4,1,2],
         'Year': [2014,2015,2014,2015,2014,2015,2016,2017,2016,2014,2015,2017],
         'Points':[876,789,863,673,741,812,756,788,694,701,804,690]}

df = pd.DataFrame(ipl_data)

grouped = df.groupby('Year')

for name,group in grouped:
    print (name)
    print (group)
2014
     Team  Rank  Year  Points
0  Riders     1  2014     876
2  Devils     2  2014     863
4   Kings     3  2014     741
9  Royals     4  2014     701
2015
      Team  Rank  Year  Points
1   Riders     2  2015     789
3   Devils     3  2015     673
5    kings     4  2015     812
10  Royals     1  2015     804
2016
     Team  Rank  Year  Points
6   Kings     1  2016     756
8  Riders     2  2016     694
2017
      Team  Rank  Year  Points
7    Kings     1  2017     788
11  Riders     2  2017     690
选择一个分组
使用get_group()方法,可以选择一个组。
ipl_data = {'Team': ['Riders', 'Riders', 'Devils', 'Devils', 'Kings',
         'kings', 'Kings', 'Kings', 'Riders', 'Royals', 'Royals', 'Riders'],
         'Rank': [1, 2, 2, 3, 3,4 ,1 ,1,2 , 4,1,2],
         'Year': [2014,2015,2014,2015,2014,2015,2016,2017,2016,2014,2015,2017],
         'Points':[876,789,863,673,741,812,756,788,694,701,804,690]}
df = pd.DataFrame(ipl_data)

grouped = df.groupby('Year')

grouped.groups
#{2014: Int64Index([0, 2, 4, 9], dtype='int64'),
# 2015: Int64Index([1, 3, 5, 10], dtype='int64'),
# 2016: Int64Index([6, 8], dtype='int64'),
# 2017: Int64Index([7, 11], dtype='int64')}

grouped.get_group(2014)
#     Team  Rank  Year  Points
#0  Riders     1  2014     876
#2  Devils     2  2014     863
#4   Kings     3  2014     741
#9  Royals     4  2014     701
Function application
聚合函数为每个组返回单个聚合值。当创建了分组(group by)对象,就可以对分组数据执行多个聚合操作。
GroupBy.apply()
对于apply()方法来说,它做了这么一个操作 将groupby分组好的数据,一组,一组,一组的传递到了函数里面。
df = pd.DataFrame({'A':['bob','sos','bob','sos','bob','sos','bob','bob'],
              'B':['one','one','two','three','two','two','one','three'],
              'C':[3,1,4,1,5,9,2,6],
              'D':[1,2,3,4,5,6,7,8]})

    A    B        C    D
0    bob    one        3    1
1    sos    one        1    2
2    bob    two        4    3
3    sos    three    1    4
4    bob    two        5    5
5    sos    two        9    6
6    bob    one        2    7
7    bob    three    6    8


grouped = df.groupby('A')

for name,group in grouped:
    print(name)
    print(group)

bob
     A      B  C  D
0  bob    one  3  1
2  bob    two  4  3
4  bob    two  5  5
6  bob    one  2  7
7  bob  three  6  8
sos
     A      B  C  D
1  sos    one  1  2
3  sos  three  1  4
5  sos    two  9  6
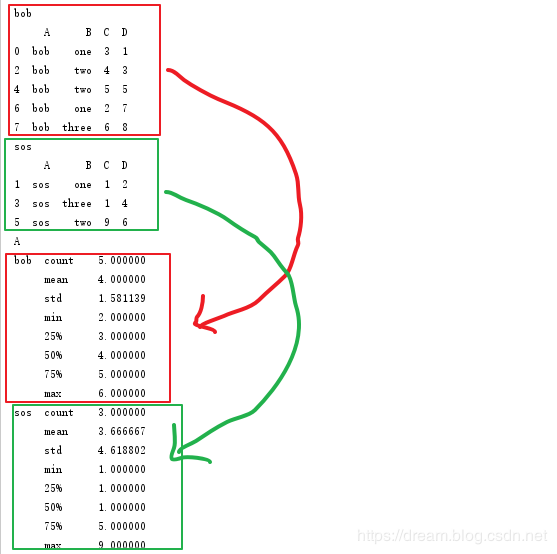
然后对结果应用apply方法
d = grouped.apply(lambda x:x.describe())
print(d)

# 输出结果
                  C         D
A
bob count  5.000000  5.000000
    mean   4.000000  4.800000
    std    1.581139  2.863564
    min    2.000000  1.000000
    25%    3.000000  3.000000
    50%    4.000000  5.000000
    75%    5.000000  7.000000
    max    6.000000  8.000000
sos count  3.000000  3.000000
    mean   3.666667  4.000000
    std    4.618802  2.000000
    min    1.000000  2.000000
    25%    1.000000  3.000000
    50%    1.000000  4.000000
    75%    5.000000  5.000000
    max    9.000000  6.000000
看好是一组,一组的传递进去, 所以,呈现出一种多层级的结构
获取分组之后的前2条数据
import pandas as pd

df = pd.DataFrame({'A':['bob','sos','bob','sos','bob','sos','bob','bob'],
              'B':['one','one','two','three','two','two','one','three'],
              'C':[3,1,4,1,5,9,2,6],
              'D':[1,2,3,4,5,6,7,8]})


grouped = df.groupby('A')

d = grouped.apply(lambda x:x.head(2))
print(d)

#        A    B        C    D
#A
#bob    0    bob    one        3    1
#        2    bob    two        4    3
#sos    1    sos    one        1    2
#        3    sos    three    1    4
不用lambda,实现一下
def get_top(df):
    return df.head(2)

d = grouped.apply(get_top)
print(d)

#        A    B        C    D
#A
#bob    0    bob    one        3    1
#        2    bob    two        4    3
#sos    1    sos    one        1    2
#        3    sos    three    1    4
将分组后的数据在进行聚合函数的时候,得到的结果可以用 index 和 value 属性进行访问聚合的结果,但结果不是 Dataframe 类型的数据,聚合结果的列没有列名,
data[data['city'] == c].groupby(
                     'bin')['aver_price'].mean()
结果
bin
(0, 100]        111.885075
(100, 200]      121.225610
(200, 300]      107.873333
(300, 400]      113.877059
(400, 500]      114.099038
(500, 600]      107.006912
(600, 700]      121.664796
(700, 800]      108.501117
(800, 900]      113.650955
(900, 1000]      94.152482
(1000, 1100]    102.882639
(1100, 1200]     96.952336
Name: aver_price, dtype: float64
GroupBy.agg()
相比于apply()函数 agg()每次只传入一列数据,并对其进行操作,也可以传入自定义的函数,和apply的用法类似。
GroupBy.agg(self, func, *args, **kwargs)
# 参数
#    fun:数据聚合的方法
df.groupby('A').agg(lambda x:print(x))

# 输出结果
0      one
2      two
4      two
6      one
7    three
Name: B, dtype: object

1      one
3    three
5      two
Name: B, dtype: object

0    3
2    4
4    5
6    2
7    6
Name: C, dtype: int64

1    1
3    1
5    9
Name: C, dtype: int64

0    1
2    3
4    5
6    7
7    8
Name: D, dtype: int64

1    2
3    4
5    6
Name: D, dtype: int64
常用的聚合方法
| 函数名 | 说明 |
|---|---|
| count | 分组中非 NA 值的数量 |
| sum | 非 NA 值的和 |
| mean | 非 NA 值的平均值 |
| median | 非 NA 值的算术中位数 |
| std 、var | 无偏(分母为 n-1)标准差和方差 |
| min、max | 非 NA 值的最小值和最大值 |
| prod | 非 NA 值的积 |
| first 、last | 第一个和最后一个非 NA 值 |
或者使用 numpy 中的聚合函数;
ipl_data = {'Team': ['Riders', 'Riders', 'Devils', 'Devils', 'Kings',
         'kings', 'Kings', 'Kings', 'Riders', 'Royals', 'Royals', 'Riders'],
         'Rank': [1, 2, 2, 3, 3,4 ,1 ,1,2 , 4,1,2],
         'Year': [2014,2015,2014,2015,2014,2015,2016,2017,2016,2014,2015,2017],
         'Points':[876,789,863,673,741,812,756,788,694,701,804,690]}
df = pd.DataFrame(ipl_data)
    Team    Rank    Year    Points
0    Riders    1        2014    876
1    Riders    2        2015    789
2    Devils    2        2014    863
3    Devils    3        2015    673
4    Kings    3        2014    741
5    kings    4        2015    812
6    Kings    1        2016    756
7    Kings    1        2017    788
8    Riders    2        2016    694
9    Royals    4        2014    701
10    Royals    1        2015    804
11    Riders    2        2017    690
grouped = df.groupby('Year')
grouped['Points'].agg(np.mean)

# Year
# 2014    795.25
# 2015    769.50
# 2016    725.00
# 2017    739.00
# Name: Points, dtype: float64
size()函数
grouped = df.groupby('Team')
grouped.agg(np.size)

# 输出结果
        Rank  Year  Points
Team
Devils     2     2       2
Kings      3     3       3
Riders     4     4       4
Royals     2     2       2
kings      1     1       1
应用多个聚合函数
grouped = df.groupby('Team')
grouped['Points'].agg([np.sum, np.mean, np.std])

# 输出结果
         sum        mean         std
Team
Devils  1536  768.000000  134.350288
Kings   2285  761.666667   24.006943
Riders  3049  762.250000   88.567771
Royals  1505  752.500000   72.831998
kings    812  812.000000         NaN
求多种聚合运算的同时更改列名
grouped['Points'].agg([('求和',np.sum), ('均值',np.mean), ('标准差',np.std)])

# 输出结果
        求和        均值            标准差
Team
Devils    1536    768.000000    134.350288
Kings    2285    761.666667    24.006943
Riders    3049    762.250000    88.567771
Royals    1505    752.500000    72.831998
kings    812        812.000000    NaN
不同的列运用不同的聚合函数
df = pd.DataFrame({'A':['bar', 'bar', 'foo', 'foo', 'foo', 'foo', 'foo'],
                   'B':['one', 'two', 'one', 'two', 'one', 'two', 'three'],
                   'C':[3,1,4,5,9,2,6],
                   'D':[1,1,1,1,2,2,3]})

# 输出结果
A    B    C        D
0    bar    one        3    1
1    bar    two        1    1
2    foo    one        4    1
3    foo    two        5    1
4    foo    one        9    2
5    foo    two        2    2
6    foo    three    6    3


grouped = df.groupby(['A','B'])
grouped.agg({'C':['sum','mean'],'D':['min','max']})
# 输出结果
            C            D
            sum    mean    min    max
A    B
bar    one        3    3.0        1    1
    two        1    1.0        1    1
foo    one        13    6.5        1    2
    three    6    6.0        3    3
    two        7    3.5        1    2
agg里面是可以使用自定义的聚合函数
grouped = df.groupby('A')

def max_min(group):
    return group.max() - group.min()

grouped.agg(max_min)

#        C    D
#A
#bar    2    0
#foo    7    2
过滤 GroupBy.filter()
过滤根据定义的标准过滤数据并返回数据的子集。filter()函数用于过滤数据。
返回三次以上参加IPL的队伍。
df.groupby('Team').filter(lambda x: len(x) >= 3)

# 输出结果
      Team  Rank  Year  Points
0   Riders     1  2014     876
1   Riders     2  2015     789
4    Kings     3  2014     741
6    Kings     1  2016     756
7    Kings     1  2017     788
8   Riders     2  2016     694
11  Riders     2  2017     690
案例
实例 1 将分组后的字符拼接
import pandas as pd
df=pd.DataFrame({
    'user_id':[1,2,1,3,3],
    'content_id':[1,1,2,2,2],
    'tag':['cool','nice','clever','clever','not-bad']
})
df

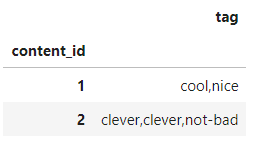
将df按content_id分组,然后将每组的tag用逗号拼接
df.groupby('content_id')['tag'].apply(lambda x:','.join(x)).to_frame()
主要是因为
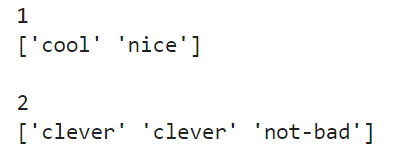
for group_name,group_values in df.groupby('content_id')['tag']:
    print(group_name)
    print(group_values.values,'\n')